
Colorado migration, mapped
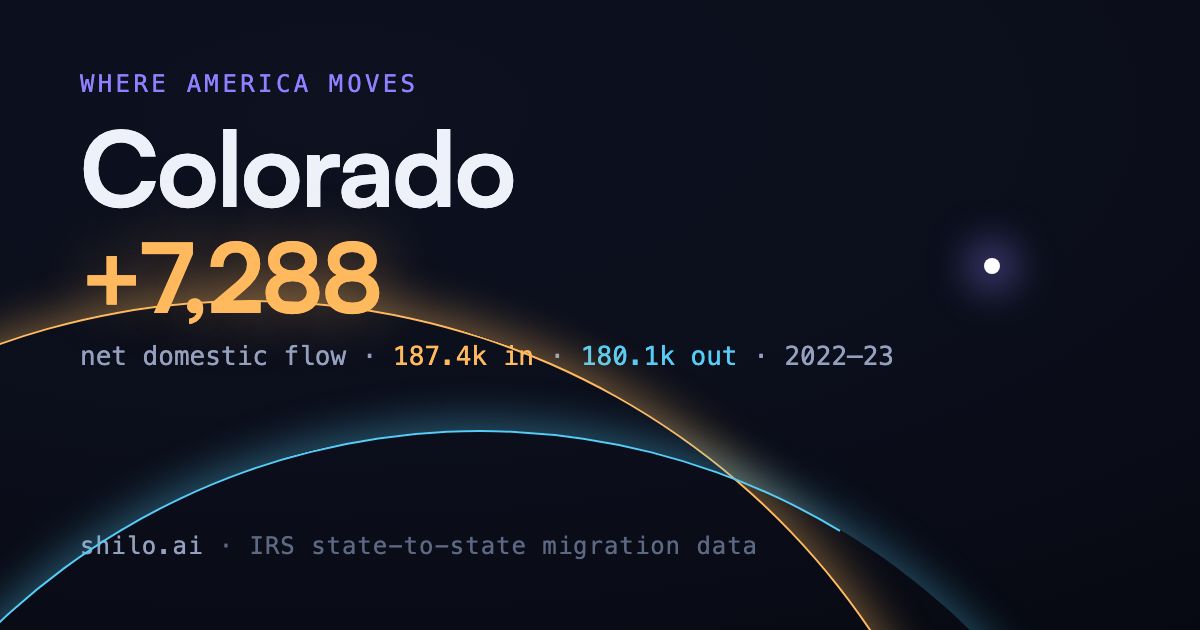
In 2022–23, 187,420 people moved into Colorado and 180,132 moved out, a net of +7,288. Drag the year slider to watch the trend, hover any state to see the corridor, or click through to explore it.
The map couldn’t load. The numbers below still tell the story.
† IRS methodology change in this year’s files (see methodology)
What the flows say
- Biggest corridors: Texas leads both directions, with 25,282 people in and 21,783 out in 2022–23.
- Trend: net flow has reversed from loss to gain over the last three years, from −4,213 in 2020–21 to +7,288 in 2022–23†.
Population · 2025
6,012,561
▲ 0.4% year over year · growing
Peak population
6,012,561
highest in the series shown (since 1910)
Why the population is changing
- Growth driver: the population grew in 2025 even after losing 12,100 people to domestic migration. International migration (+15,356) and births minus deaths (+20,608) more than made up for it.
- Peak population: the 2025 estimate of 6,012,561 is the highest on record, in data going back to 1910.
Net income flow · 2022–23
+$715M
▲ $10.0B arrived · $9.3B left
Avg household income · movers
$83k in · $85k out
similar incomes both directions
Colorado wealth migration
- Money moved: households moving into Colorado in 2022–23 reported $10.0B in income (AGI). Households leaving took $9.3B with them, a net gain of $715M.
- Income gap: the average household moving in reported $83k of income, vs $85k for leavers. Arriving and leaving households report similar incomes.
Drill into a metro
IRS data goes deeper than states. Pick a metro to see its own corridors.
About the data
Migration figures come from the official IRS state-to-state files (exemptions ≈ people). Population figures are Census Bureau estimates, and the peak checks every census back to 1910. Income figures are the total income (AGI) movers reported in the same IRS files. Dollars are not adjusted for inflation, and household averages divide by the number of returns. Years marked † had a change in how the IRS built the files. Full details, caveats, and a suggested citation on the methodology page.
Download this data (CSV), free to use with attribution.
Every year, thousands of people move to Colorado
They all start with a call to an agent. Shilo's AI grades your calls and coaches you, so that call always goes your way.