
Texas migration, mapped
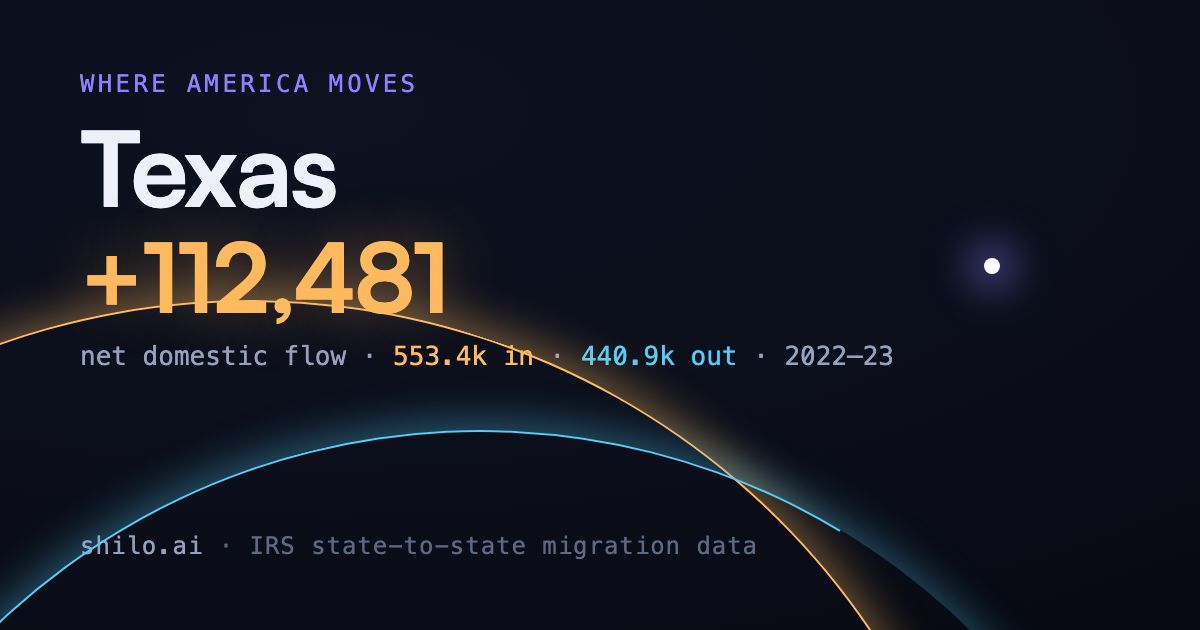
In 2022–23, 553,369 people moved into Texas and 440,888 moved out, a net of +112,481. Drag the year slider to watch the trend, hover any state to see the corridor, or click through to explore it.
The map couldn’t load. The numbers below still tell the story.
† IRS methodology change in this year’s files (see methodology)
What the flows say
- Biggest corridors: California leads both directions, with 82,481 people in and 41,232 out in 2022–23.
- Trend: net inflow has cooled over the last three years, from +174,866 in 2020–21 to +112,481 in 2022–23†.
Population · 2025
31,709,821
▲ 1.2% year over year · growing
Peak population
31,709,821
highest in the series shown (since 1910)
Why the population is changing
- Growth driver: growth is led by international migration (+167,475); domestic migration added +67,299 in 2025.
- Peak population: the 2025 estimate of 31,709,821 is the highest on record, in data going back to 1910.
Net income flow · 2022–23
+$5.5B
▲ $25.7B arrived · $20.2B left
Avg household income · movers
$84k in · $80k out
arrivals out-earn leavers by 5%
Texas wealth migration
- Money moved: households moving into Texas in 2022–23 reported $25.7B in income (AGI). Households leaving took $20.2B with them, a net gain of $5.5B.
- Income gap: the average household moving in reported $84k of income, vs $80k for leavers. Arrivals out-earn leavers by 5%.
Drill into a metro
IRS data goes deeper than states. Pick a metro to see its own corridors.
- Dallas 8,477,157 people
- Houston 7,904,627 people
- San Antonio 2,813,140 people
- Austin 2,620,945 people
- McAllen 921,549 people
- El Paso 881,291 people
- Killeen 511,497 people
- Corpus Christi 451,191 people
- Brownsville 433,946 people
- Beaumont 399,310 people
- Lubbock 368,431 people
- Waco 308,807 people
- Longview 297,315 people
- College Station 287,476 people
- Laredo 281,224 people
- Amarillo 276,235 people
- Tyler 252,549 people
- Midland 193,139 people
- Abilene 185,429 people
- Odessa 173,801 people
- Sherman 153,613 people
- Wichita Falls 149,448 people
- Texarkana 146,816 people
- San Angelo 122,065 people
- Victoria 99,864 people
- Eagle Pass 58,823 people
About the data
Migration figures come from the official IRS state-to-state files (exemptions ≈ people). Population figures are Census Bureau estimates, and the peak checks every census back to 1910. Income figures are the total income (AGI) movers reported in the same IRS files. Dollars are not adjusted for inflation, and household averages divide by the number of returns. Years marked † had a change in how the IRS built the files. Full details, caveats, and a suggested citation on the methodology page.
Download this data (CSV), free to use with attribution.
Every year, thousands of people move to Texas
They all start with a call to an agent. Shilo's AI grades your calls and coaches you, so that call always goes your way.